Understanding volume indicators is crucial for any serious trader. These tools provide insights beyond price movements, revealing market sentiment and potential trend reversals. By leveraging volume data, traders can make more informed decisions, optimizing their entry and exit points. Dive into the world of volume indicators and discover how they can enhance your trading strategy. Learn the significance of volume indicators in trading with insights from Bitcore Method educators. Their expertise can help you effectively use these indicators to inform your trading strategies.
Enhancing Trade Entry and Exit Decisions
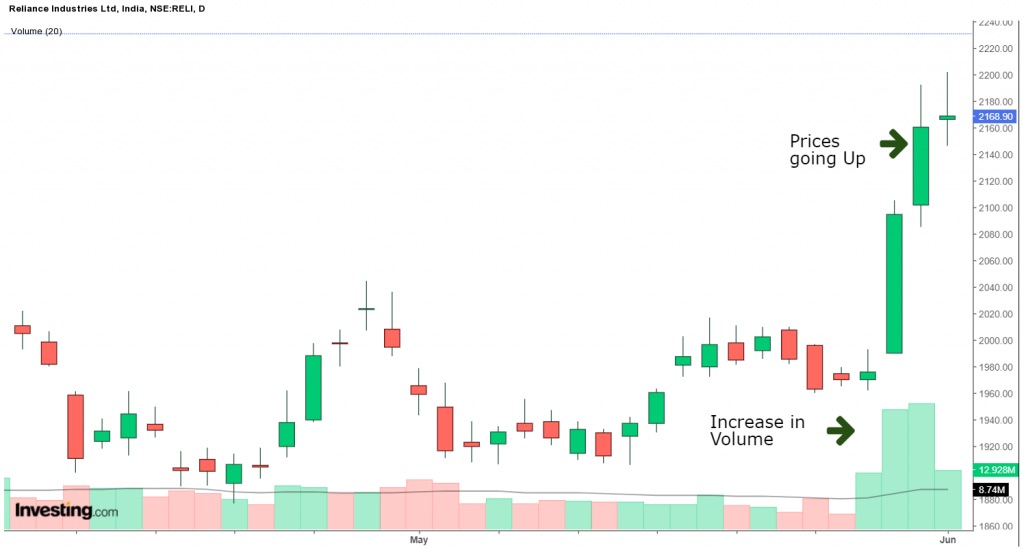
Volume indicators play a key role in refining trade entry and exit strategies. When traders see high trading volume, it often signals strong interest in an asset, making it a good time to enter or exit. For example, if a stock’s price rises significantly with high volume, it suggests that the trend may continue. This can be a good entry point. Conversely, if the price drops on high volume, it might be a signal to sell.
Using volume indicators helps traders confirm the strength of a price move. For instance, let’s say you’re eyeing a stock that has been steadily climbing. If this rise is accompanied by increasing volume, it indicates genuine buying interest. On the other hand, if the volume is low during a price increase, it could mean the move lacks conviction, and the price might not hold.
Volume indicators also aid in spotting potential reversals. If a stock is in a downtrend but suddenly experiences a spike in volume without a significant price drop, it could signal that sellers are exhausted and buyers are stepping in. This could be a cue to consider entering a trade anticipating a trend reversal.
One popular volume indicator is the Volume Moving Average (VMA), which smooths out volume data over a specified period. It helps traders see the average volume and spot anomalies. For example, a sudden spike above the VMA can highlight an unusual trading activity worth investigating.
Volume as a Confirmation Tool for Price Movements
Volume indicators serve as crucial confirmation tools in trading, adding another layer of insight beyond price movements. When a stock’s price changes, the accompanying volume can validate the strength and sustainability of that move. For instance, a price increase backed by high volume suggests robust buying interest, whereas a rise with low volume might be suspicious.
Consider a scenario where a stock breaks out of a consolidation phase with significant volume. This high volume confirms that many traders are participating in the move, indicating a higher likelihood that the breakout is genuine. Conversely, if a breakout happens with low volume, it might be a false signal, and the price could quickly revert.
Volume also helps confirm trends. In an uptrend, increasing volume supports the continuation of the trend. If the volume starts to wane, it might signal that the trend is losing steam. This can be particularly useful for traders who rely on trend-following strategies, as it provides a cue to either stay in the trade or prepare for an exit.
Another example is during price corrections. If a stock pulls back with low volume, it often means the correction is temporary and the primary trend is likely to resume. However, a pullback on high volume might indicate a more serious reversal.
Volume indicators like the On-Balance Volume (OBV) are particularly useful. OBV adds volume on up days and subtracts it on down days, creating a cumulative total that can confirm price trends. For example, if the price is rising but OBV is falling, it could signal a divergence, suggesting the price move may not be sustainable.
Identifying Market Strengths and Weaknesses
Volume indicators are essential for identifying market strengths and weaknesses, offering traders a deeper understanding of market dynamics. High trading volume often signifies strong market interest and can highlight areas of strength. For example, if a stock consistently trades with high volume during upward movements, it indicates robust buying interest and market confidence.
Conversely, low volume during price rises or falls can expose market weaknesses. For instance, if a stock’s price is climbing but the volume is decreasing, it might suggest that the rally is losing momentum. This could be a warning sign that the uptrend is not supported by strong buying interest and might reverse soon.
Volume can also reveal weaknesses during downtrends. If a stock is declining on high volume, it indicates strong selling pressure, reflecting a lack of confidence in the asset. However, if the price drops on low volume, it might suggest that the selling is not widespread, and the price could recover.
Traders often look at volume spikes to identify potential turning points. A sudden increase in volume can signal a change in market sentiment. For example, if a stock in a downtrend experiences a volume spike without a significant price drop, it might indicate that sellers are exhausted, and buyers are starting to step in, potentially reversing the trend.
Conclusion
Volume indicators are indispensable in trading, offering a deeper look into market dynamics. They confirm price movements, highlight trends, and expose market strengths and weaknesses. By integrating these tools into your strategy, you can trade more confidently and effectively. Always remember to combine volume analysis with other indicators for the best results. Happy trading!


