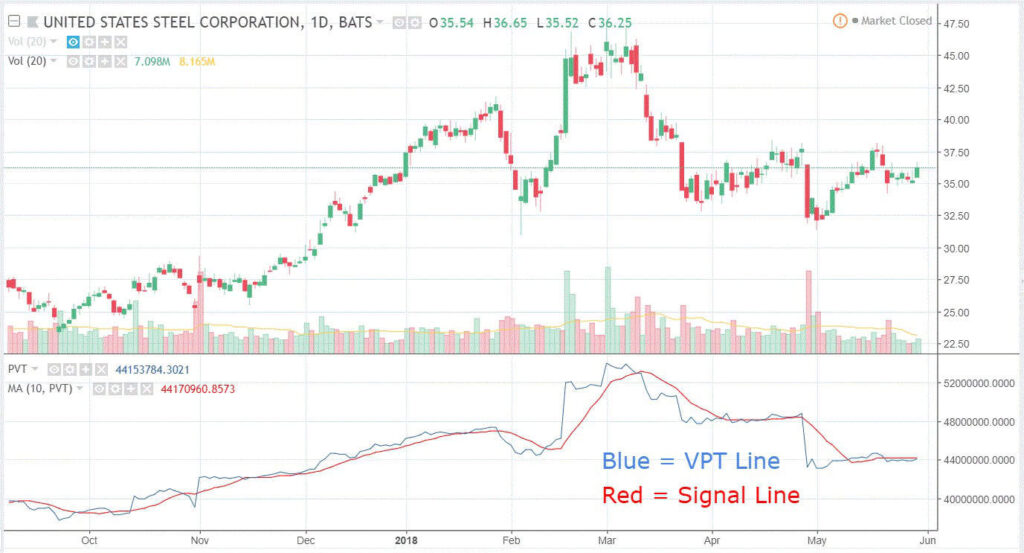
Volume indicators are the unsung heroes of trading, providing critical insights into market activity and strength. By analyzing trading volume, these tools help traders confirm trends, spot reversals, and make informed decisions. Understanding how volume indicators work can transform your trading strategy and give you a significant edge in the market. Go https://finance-phantom.org/ now and connect with an expert to learn more.
Overview of Volume Indicators in Financial Markets
Volume indicators are essential tools in the financial market that track the number of shares or contracts traded in a security or market during a given period. By providing insight into the activity and liquidity of a security, volume indicators help traders understand the strength of a price movement. For example, a price increase accompanied by high volume indicates strong market interest and momentum.
Traders use volume indicators to confirm trends, identify potential reversals, and spot significant trading opportunities. They are crucial in both bullish and bearish markets, helping to filter out noise and focus on meaningful price movements. Common volume indicators include On-Balance Volume (OBV), Volume Oscillators, and the Accumulation/Distribution Line.
For instance, OBV is a simple yet effective indicator that adds volume on up days and subtracts volume on down days, providing a cumulative total that helps identify buying and selling pressure. Volume Oscillators, on the other hand, measure the difference between two volume moving averages, highlighting overbought or oversold conditions. The Accumulation/Distribution Line combines price and volume to determine the overall flow of money into or out of a security.
Importance of Volume Analysis in Trading Strategies
Volume analysis plays a pivotal role in crafting effective trading strategies. By examining the amount of trading activity, traders gain insights into market strength and potential price direction. It’s not just about knowing the current price; it’s about understanding the volume behind it. For instance, a stock may show a price increase, but if the volume is low, the upward trend may lack sustainability. Conversely, high volume during a price increase often signals a robust trend, suggesting that the price move has strong backing.
One of the key benefits of volume analysis is its ability to confirm trends. Traders look for volume spikes to validate the legitimacy of price movements. For example, in an uptrend, increasing volume can indicate that buyers are confident and driving the price higher. If the price rises but volume decreases, it might suggest that the trend is losing steam, and a reversal could be on the horizon.
Volume analysis also helps in identifying potential reversals. Divergence between price and volume can be a warning sign. If prices are rising but volume is falling, it could indicate that fewer traders are willing to buy at higher prices, potentially leading to a downturn. Similarly, during a downtrend, if volume decreases while prices continue to fall, it might suggest that selling pressure is waning, signaling a potential bottom.
Moreover, volume analysis is crucial in detecting breakouts. High volume during a breakout confirms that the price move is supported by a significant number of traders, reducing the risk of a false breakout. For instance, when a stock breaks through a resistance level on high volume, it is more likely to continue its upward movement than if the breakout occurs on low volume.
Key Types of Volume Indicators
Volume indicators come in various forms, each offering unique insights into market dynamics. Understanding these different types can significantly enhance a trader’s ability to interpret market movements and make informed decisions.
One popular volume indicator is the On-Balance Volume (OBV). OBV measures buying and selling pressure by adding volume on up days and subtracting volume on down days. This cumulative total helps traders identify trends and potential reversals. For instance, a rising OBV suggests that buyers are in control, while a falling OBV indicates selling pressure.
Another crucial volume indicator is the Accumulation/Distribution Line (A/D Line). This indicator considers both price and volume to determine the flow of money into or out of a security. By comparing the closing price to the trading range and multiplying by volume, the A/D Line provides insights into the strength of a trend. A rising A/D Line indicates accumulation, suggesting that buyers are accumulating shares, while a falling A/D Line indicates distribution, implying selling pressure.
Volume Oscillators, such as the Chaikin Oscillator, are also valuable tools. These indicators measure the difference between two moving averages of volume, highlighting overbought or oversold conditions. For example, when the oscillator moves above zero, it suggests buying pressure, while a move below zero indicates selling pressure. This helps traders identify potential entry and exit points.
The Money Flow Index (MFI) is another important volume indicator. Combining price and volume data, the MFI measures buying and selling pressure. It oscillates between 0 and 100, with values above 80 indicating overbought conditions and values below 20 suggesting oversold conditions. The MFI helps traders identify potential reversal points and confirm trends.
Volume Rate of Change (VROC) is a simple yet effective indicator that measures the percentage change in volume over a specified period. This helps traders identify significant changes in trading activity, which can signal potential trend reversals or breakouts.
Conclusion
Mastering volume indicators can revolutionize your trading approach. By incorporating these powerful tools into your strategy, you’ll gain deeper insights into market trends and trading activity. Stay informed, make smarter decisions, and enhance your trading performance with a solid grasp of volume indicators.


